


Business Intelligence @ Work
Amongst other services, alintra provides the flexible analysis of heterogenuous data structures. Based on previous work carried out in the field of Business Intelligence, alintra is experienced in creating interactive graphical reports and in analysing the relevant aspects from the client's perspective.
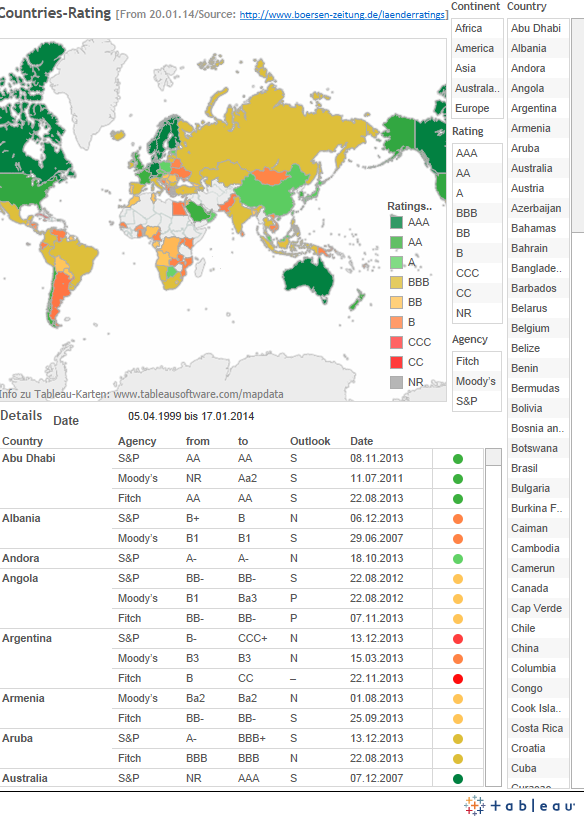
The following example demonstrates how country ratings, which have been compiled by the B—rsen-Zeitung, can be transformed into user-friendly information. The primary source can be found here: [link]
Simply click the fields on the example provided in order to perform an analysis at your discretion. You can select continents, countries, rating agencies and a date.
Ratings, and the related judgements, have a tendency to change over time and can partly differ among rating agencies. The colored ratings are based on the gross ratings. Please take into account that the map-chart displays the color-code for only one agency, which is either chosen with the filter or selected from the source data (perform a mouseover over a country on the map-chart in order to view which agency's rating has been color-coded in the pop-up).
Note: There is a "reset"- option on the bottom of your screen; this will restore the original view and reset all filters. Please refer to this guidance video for further tips.
![Countries-Rating [From 07.04.14/Source: http://www.boersen-zeitung.de/laenderratings]](http://public.tableausoftware.com/static/images/Ln/Lnder-Rating_EN_3_3_14/LnderRating/1_rss.png)